Inbox Health’s reporting and analytics are aligned with your billing operations to help you understand your business, measure your success, and maximize your revenue.
Preparing for Deductible Season for Billers
Read More

Inbox Health’s reporting and analytics are aligned with your billing operations to help you understand your business, measure your success, and maximize your revenue.
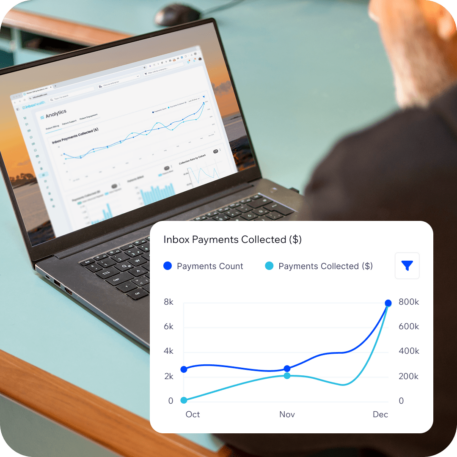
Unlock the value of your data with Inbox Health’s analytics and performance insights. Turn insights into action with reports and dynamic visuals that track data for all of your practices in one place.
Streamline billing and reporting insights by tracking patient payment trends and measuring the most effective way to collect outstanding balances.
Uncover trends in billing engagement across practices to identify areas for improvement to optimize your workflow.
Quickly pinpoint revenue-generating opportunities within the billing cycle across multiple practices and providers.
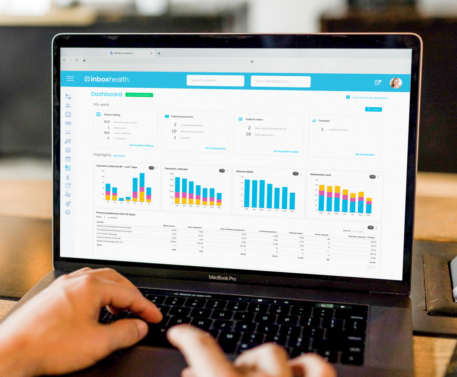
To effectively manage your bottom line, you need powerful business analytics aligned to your operations and integrated into your workflow. Inbox Health scales your reporting and analytics. The platform understands your baseline performance and optimizes your processes with standard reports and dynamic dashboard visuals, highlighting key performance metrics that turn insights into strategic actions.

Track and report data for all of your practices and providers in a single, easy-to-use experience.
Quick access to standard reports for immediate use by exporting for additional analysis or to use as work lists.
Export any of the dashboard analytics for use in your presentations to facilitate sharing your data story.
A data dictionary for key metrics is available in our Learning Center – linked directly from the Reports center as a way to learn more about key business metrics and reports.
Our at-a-glance analytics dashboard details payments collected, patients billed, payment velocity, and patient engagement. With dynamic filtering and visual exports, data is at the ready to help share your performance,measure trends, and optimize revenue opportunities.
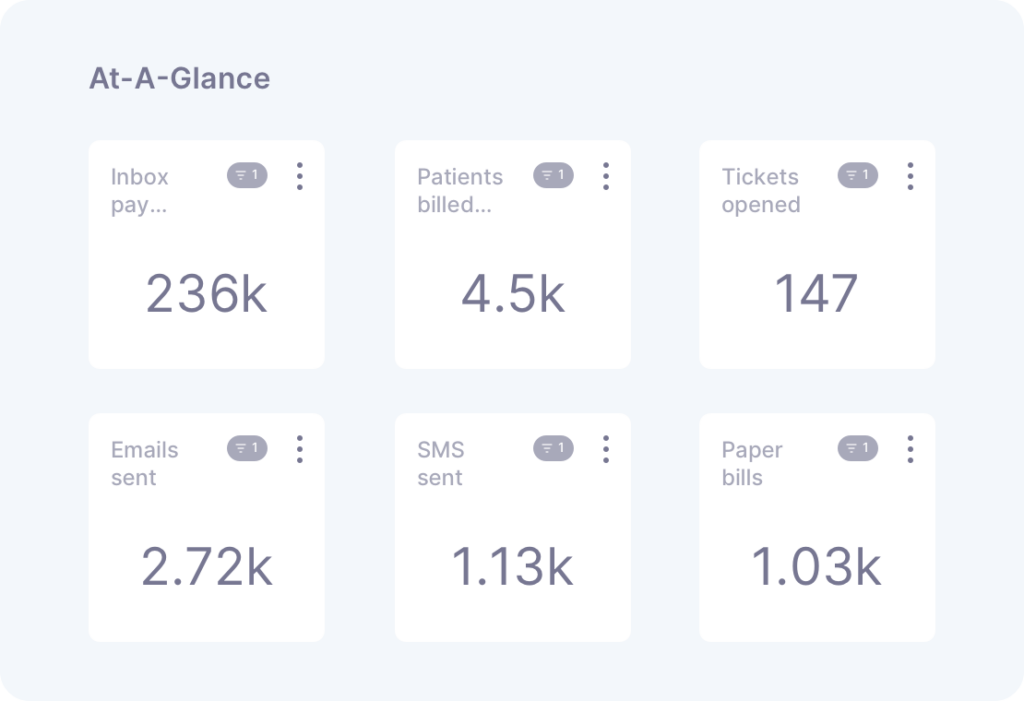
At-A-Glance Metrics provide a snapshot of key billing metrics detailing payments received, patients billed, support tickets opened, statements delivered by channel, and payment velocity at any customized date range.
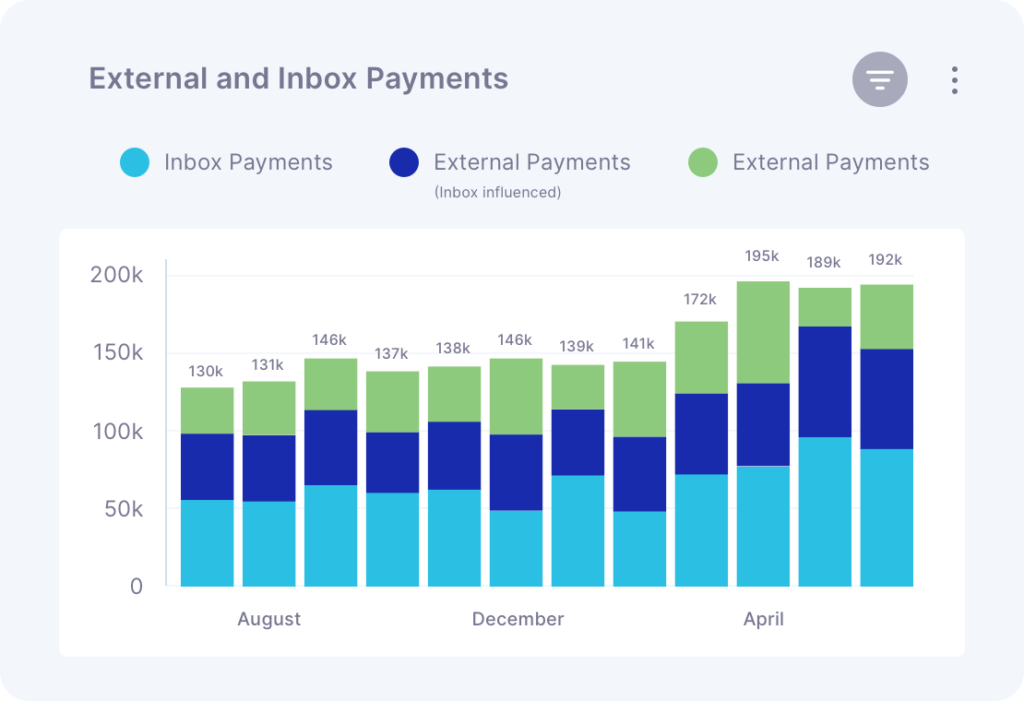
Patient Billing metrics provides details regarding unique patients billed and a sum of patients collected through our portal, with key emphasis in a breakdown of payments collected through our platform and influenced from our billing actions, to see the value of Inbox Health over time compared to internal collections.
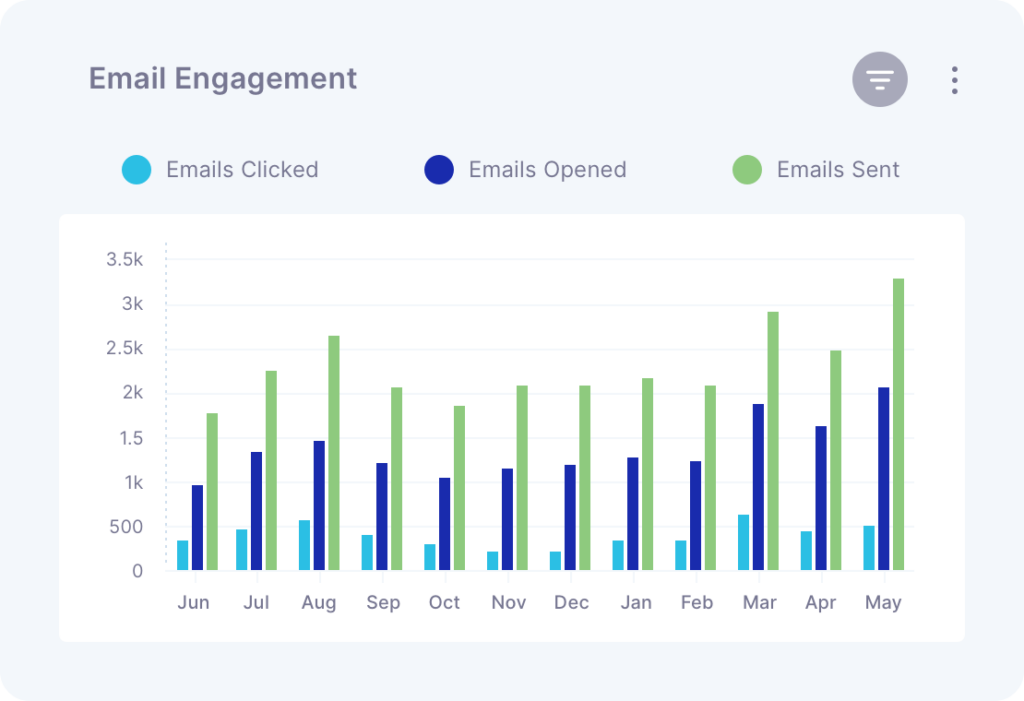
Patient Engagement and Support metrics can help you understand the volume of patient support tickets and payment behaviors.
Understand your billing cycle performance for individual practices and across your entire book of business. Analytics support custom billing cycles so you can see with granularity which strategies are accelerating collections via tailored outreach.
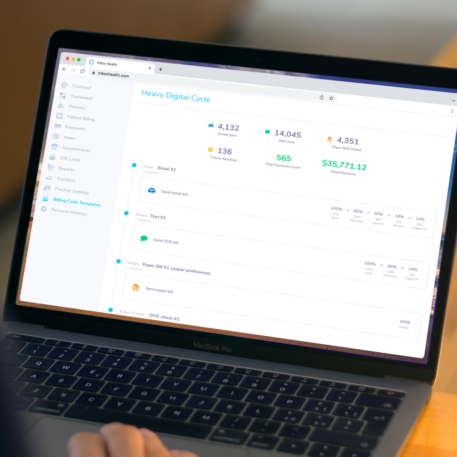
Key patient billing, payment and support metrics in a single report to share your performance, identify areas of success, and determine areas to improve.
View all patients, new patients, duplicates, and all patient balances.
View payment detail by method.
View A/R aging broken out by patient and aged trial balance.
Export collections reporting by patient.
Better understand the performance of your team’s response to patient questions, how your patients are interacting with your system, and time to resolution.
Patient billing analytics is the process of tracking and interpreting data across the patient billing cycle — including payments collected, patient engagement, statement delivery, A/R aging, and payment velocity — to help billing teams make informed decisions, improve collection rates, and optimize their revenue cycle operations.
Inbox Health tracks a comprehensive set of patient billing KPIs including payments received, patients billed, payment velocity, statement delivery by channel (email, text, and paper), patient support ticket volume and resolution time, cost-to-collect, billing cycle performance by practice, and a breakdown of Inbox Health-influenced collections vs. external collections. All metrics are available across customizable date ranges and filterable by practice or provider.
Yes. Inbox Health is built specifically for billing companies and practices managing multiple locations. The analytics dashboard aggregates data across your entire book of business, so you can view portfolio-wide trends or drill into individual practice performance — all from a single interface.
Any dashboard visual or standard report in Inbox Health can be exported directly from the platform. You can use these exports for client presentations, internal performance reviews, or additional analysis in Excel — without any manual data aggregation.
Inbox Health includes a unique “Influenced and Inbox Payments” report that shows both the payments collected through the platform and the total revenue from patient collections, including Inbox-influenced results. This gives billing companies a clear, data-backed story to present to clients in quarterly reviews — showing the measurable impact of their billing strategies.
Inbox Health includes a unique “External and Inbox Payments” report that shows both the payments collected through the platform and the total revenue from patient collections, including Inbox-influenced results. This gives billing companies a clear, data-backed story to present to clients in quarterly reviews — showing the measurable impact of their billing strategies.
Inbox Health provides both. The at-a-glance dashboard offers real-time visibility into current billing performance, while standard reports enable historical trend analysis across any customizable date range — so billing teams can monitor what’s happening now and identify longer-term patterns.
Inbox Health was built for medical billers. Click below and schedule a quick chat – let’s get to know each other.